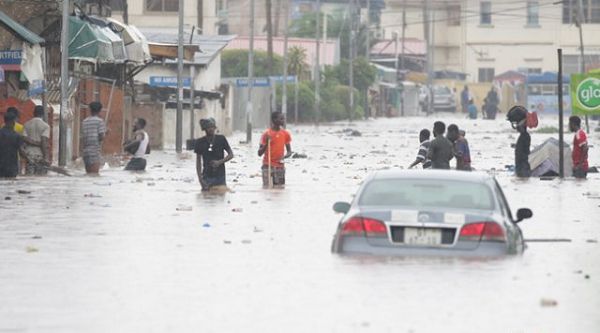
 File Photo (Flooding in Accra after heavy downpour)
Sea level rise keeps speeding up, and “many coastal areas are lower than scientists thought they were,” said Ronald Vernimmer, lead author of the new study published last week in Earth’s Future, a journal of the American Geophysical Union.
Up until a few years ago, most estimates of how fast rising seas will inundate shorelines were based on radar measurements that can’t distinguish between tops of plants and buildings and the actual elevation of the ground beneath them, “and therefore overestimate surface elevation,” said Vernimmen, who works with the Dutch research firm Data for Sustainability.
The findings of the study won’t improve the accuracy of sea level rise estimates for the United States, which already uses lidar readings from aerial missions that are even more accurate than the satellite data, said William Sweet, a sea rise expert with the National Oceanic and Atmospheric Administration.
But, he said, the paper “is an important advance for many countries that are lacking accurate coastal elevation information to assess their changing flood risk as sea levels rise.”
For example, the new data suggest that seas 6.6 feet higher would put most of Bangkok and its 10 million residents below sea level, while previous projections showed that Bangkok would still be mostly above sea level with water that much higher. Globally, Vernimmen and his co-author Aljosja Hooijer estimated that 240 million more people than previously projected would be living below sea level with oceans that much higher.
New Data Can Help Developing Countries Plan
Globally, sea level has risen about 8 inches since the start of the 20th century, with more than 2 inches of that arriving in just the past 20 years, according to NASA. The rate of the water’s climb has increased from about 1.2 inches per decade in the late 20th century to about 2 inches per decade in the last 20 years.
The most recent climate assessment by the Intergovernmental Panel on Climate Change projects an average global sea level rise of about 20 inches by 2100, but scientists say there’s a chance it could rise by as much as 3 feet if worst-case scenarios for ice sheet meltdowns in Greenland and Antarctica materialize.
There are also significant regional variations in sea level rise due to a complicated set of variables, including changes in the gravitational pull of areas where large amounts of ice are melting, as well as differing rates of land subsidence around the world. The bottom line is that some areas in the Global South that can least afford to deal with sea level rise are going to be affected the most, including small island nations, especially in the tropical and South Pacific, as well as densely populated parts of Asia and Africa.
“For the 1 meter of sea level rise that could occur by the end of this century, and is pretty much bound to occur by the end of the next century, this new dataset is at the top end of the range of predicted exposure,” said Jim Hall, a professor of climate and environmental risks in the University of Oxford, who was not involved in the study. “It is getting closer to the truth.”
Vernimmen said that lidar data sets useful for mapping coastal vulnerability to sea level rise just started emerging in the last five to 10 years.
“It was mainly developed for monitoring what is happening with polar ice sheets, but they also luckily sometimes turned on the sensor over land,” including some of the coastal areas he had already been studying in Indonesia, he said. “We saw the quality. So we started compiling all this data and processing it for the world, basically, but with a focus on Southeast Asia.”
The study he led analyzed global data from NASA’s ICESat-2 satellite, which uses light detection and ranging (lidar) to get more accurate measurements. A lidar instrument combines information from laser pulses, a scanner and a specialized GPS receiver to generate detailed three-dimensional information of features on the surface of the Earth.
The new study shows that every increment of sea level rise will cover more than twice as much land as older models predicted, and marks another advance in providing more accurate models of rising seas said Stefan Rahmstorf, a climate scientist with the Potsdam Institute for Climate Impact Research, who was not involved in the study.
“It is no surprise that, particularly for moderate sea-level rise, the improved elevation data are bad news,” he said. “More flooding can be expected for a given rise of 1 meter or 2 meters, and more people live in areas vulnerable to rising seas than was estimated with the old elevation models.”
Co-author Aljosja Hooijer said that, until the ICESat-2 lidar data became available, it was very expensive to map coastal vulnerability to sea level rise.
“Typically, you find these things in the more developed nations,” he said. But that has resulted in a scientific bias, with less information available in the poorer, less developed countries in the Global South. On top of that, some of the biggest cities in those regions are pumping so much groundwater that the land is sinking at the same time that sea level is rising, increasing their vulnerability, he said.
Some of the areas the new study identified as more vulnerable than previously thought also have rapidly growing populations, putting even more people at risk.
“Think of Lagos in Nigeria,” he said. “They’re poorly managed and they don’t have geographic data. They don’t have elevation models and they don’t do spatial planning, and they use groundwater. They are literally pumping themselves downward, because the ground subsides where you extract groundwater. And these are all soft, sloppy coastal soils, lots of mangrove clay, stuff that can subside by many meters easily. So that’s like a triple whammy.”
Findings Figure Into Loss and Damage Discussions
The findings are critical because about 40 percent of the world’s population lives in coastal zones, said Roseanne Martyr-Koller, an expert on coastal vulnerability and adaptation with Climate Analytics, a Berlin-based nonprofit climate think tank.
“This affirms what small island developing states have been saying for a while,” she said. “We are getting wet, we are flooded. We are losing land. This is not just an isolated cry or a political ploy.”
And the study also shows, once again, the global imbalance in where and how research is done, and that millions of people are feeling climate impacts right now, and not in the distant future, she added.
“Developed countries simply have more research done in their spaces than developing countries do,” she said. “And so developing countries lack this basic information that is used in risk assessments for adaptation and decision making. I think it’s a really critical feature of this research that it starts to shine lights on those understudied areas.”
The study also helps inform discussions on loss and damage, a critical part of international climate governance that would establish payments from developed, rich countries that have done the most to cause global warming to develop countries that are enduring most of its impacts.
“We know that, for developing countries and developed countries, we have economic zones that are in the coastal zone that stand to be affected,” she said. “We have cultural heritage sites that stand to be lost. So any information that can be provided on what is at stake—and that’s what this study does—feeds into the loss and damage discussion. And more is at stake than we thought.”
Comments